
How to Make a Datadog Clone in a Weekend
DataDog is a great tool.
But there was a view I was unable to build in DataDog…
This is the story of how I decided to build my own observability platform because I didn’t want to learn how to use datadog.
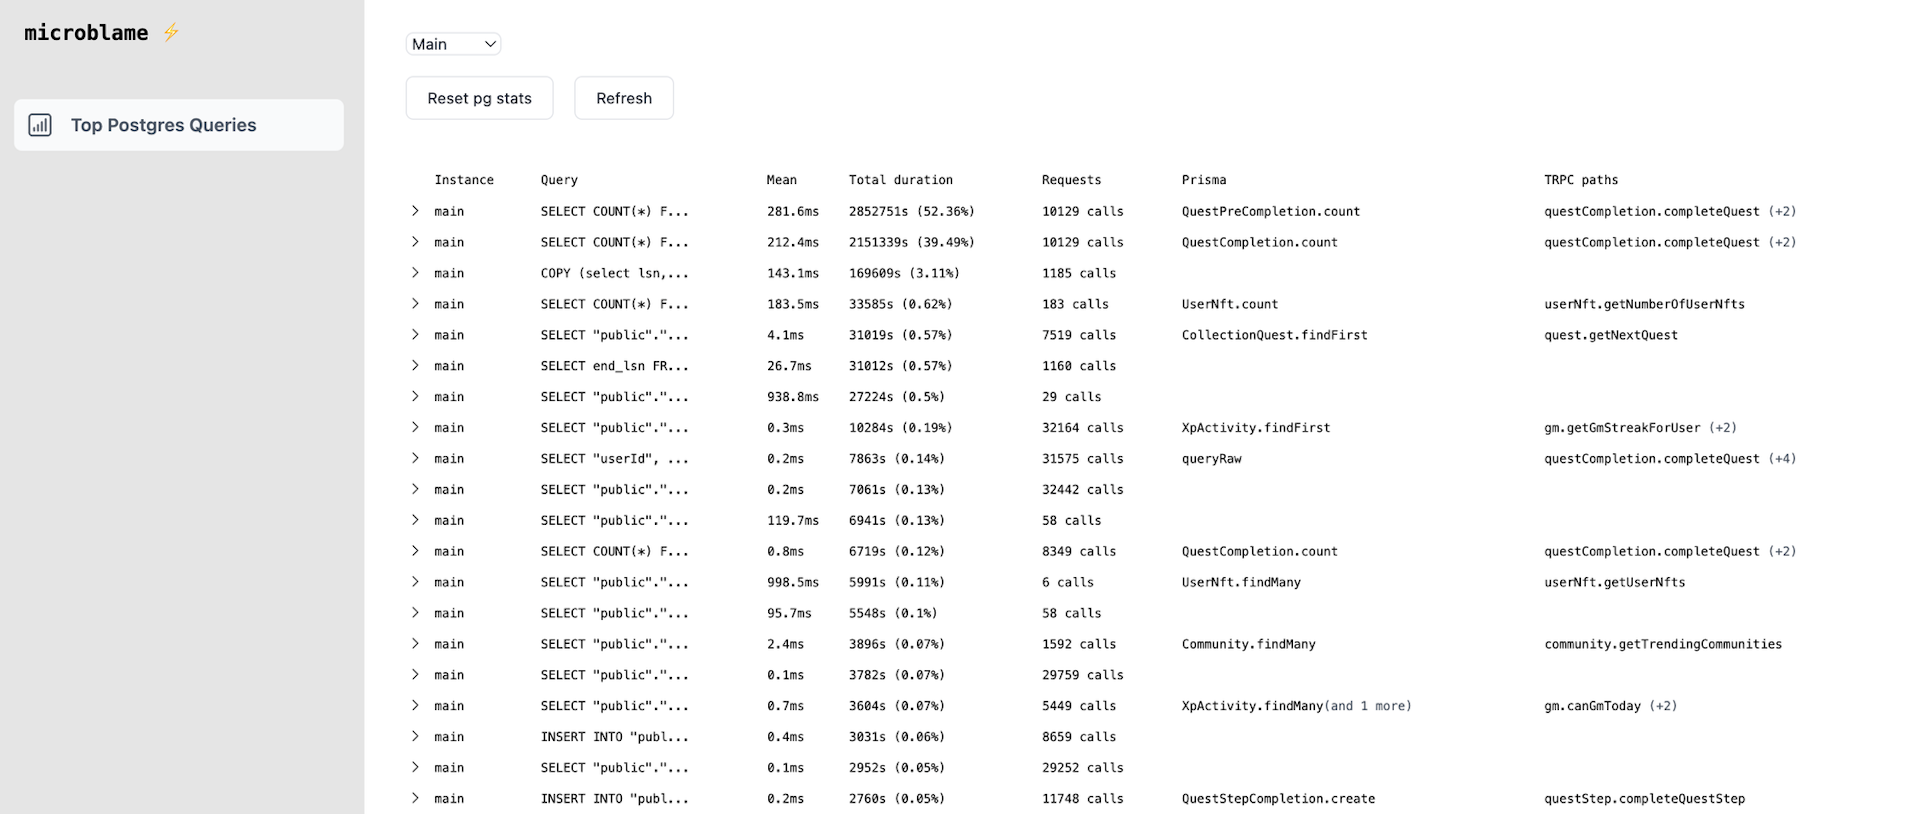
What I want: A list of the slowest database queries in the app, along with information on where to find them. The information about the queries should come from the db (pg_stat_statements), because it’s more accurate, while the observability data should show me where this query is created in code.
I am unable to build this in Datadog. I have tried. It might be possible, but have never suceeded. When working with products like datadog I often become frustrated. I just want to build a query with raw sql, or some code. Especially now, with chatgpt, it’s so much easier to build stuff like that. I don’t want your shitty UI.
Ingest telemetry to ClickHouse
I was surprised of how easy it has to set up a fully fledged opentelemetry backend, with logs/metrics/traces ingestion and a state-of-the art analytical database.
Deploy the otel-collector docker image and add a exporter: clickhouse field in the config. This will give you an ingestion endpoint, /v1/traces, it will initialize the clickhouse db, and all traces, metrics and logs will be added and organized. It’s magic!
In order to not have to deal with too much data, or scaling the infra, we set ttl to something low, like 30 minutes. This will keep the database super fast even on a modest infra and big amounts of data.
With a simple docker compose file, you can run one command to spin up a otel-collector and a clickhouse db, ready for runnning analytical queries on it. Pretty cool.
Making a frontend to query and show the data
Now that we have the telemetry data in the Clickhouse db, it’s just a matter of querying it.
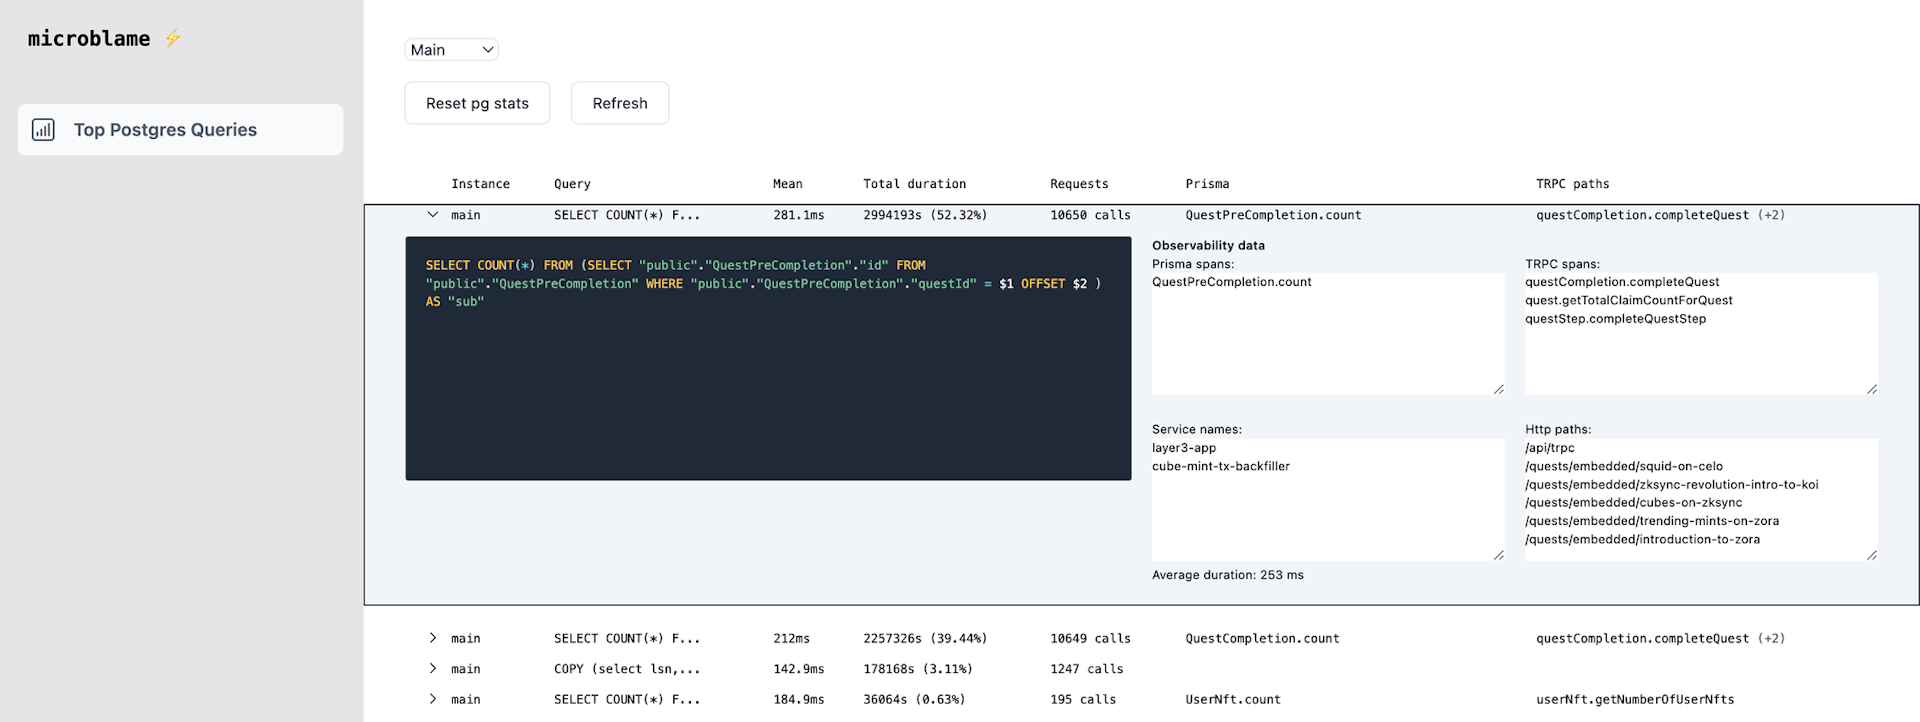
In my case, I made some scripts and a frontend to:
- Give me the slowest queries from
pg_stat_statements
- Match these queries with the traces from the clickhouse db.
- Map it to
http targets,prisma span names,trpc paths,service names. This gives me an accurate view of where to find the query in code
- Make a React frontend to show this
The result:


Deploy this
I called this app microblame. It is open source and available here. All you need to deploy it is to run docker compose up, and you get the ingestion from opentelemetry, db from Clickhouse, and the microblame frontend to see queries.

Hi!
I'm Lars. I write about building scalable systems, software architecture, and programming.
I created Turfemon to be my playground. A place where I can dive into technical topics, share quick insights, and document my learning journey, without contaminating my main site's pristine collection of 'profound' insights.
Working on something exciting? Send me an email: show email